Python からはじめる数学入門 (Doing Math with Python)(まとめ記事)の第 2 章を読む。今回のテーマは matplotlib を利用したグラフの表示。
内容
- 数直線
- デカルト座標系
- リスト
- matplotlib
- 折れ線グラフ
- マーカー
- Legend(凡例)
- タイトルと軸ラベル
- 軸の範囲の変更
- 実例: ニュートン力学
- 万有引力: 横軸は物体間の距離、縦軸は万有引力の強さ
- Projectile Motion(放物運動)
Projectile Motion(放物運動)
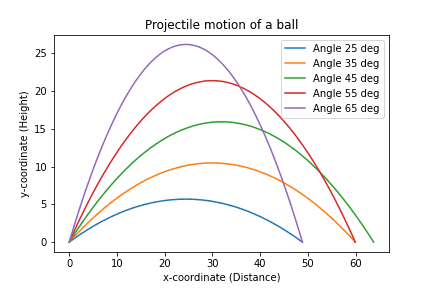
本では初速を変動させてるけど、より興味深い 角度の変動 に改造した。
import math


# Generate equally spaced floating point numbers between two given values
def f_range(start, final, increment):
    numbers = []

    while start < final:
        numbers.append(start)
        start += increment

    return numbers


def calc_trajectory(u, theta):
    g = 9.8

    theta = math.radians(theta)

    # Time of flight
    t_flight = 2 * u * math.sin(theta) / g
    # time intervals
    intervals = f_range(0, t_flight, 0.001)

    # List of x and y coordinates
    x = []
    y = []
    for t in intervals:
        x.append(u * math.cos(theta) * t)
        y.append(u * math.sin(theta) * t - 0.5 * g * (t ** 2))

    return (x, y)


def draw_graph():
    fig, ax = plt.subplots()

    ax.set_title("Projectile motion of a ball")
    ax.set_xlabel("x-coordinate (Distance)")
    ax.set_ylabel("y-coordinate (Height)")

    for angle in range(25, 75, 10):
        x, y = calc_trajectory(25, angle)
        ax.plot(x, y, label="Angle {0} deg".format(angle))

    ax.legend()
    plt.show()

    fig.savefig("chap2_visualizing-data-with-graphs_projectile-motion.png")


draw_graph()
上から順番に f_range() 関数は range() 関数の浮動小数点対応版。calc_trajectory() 関数は与えられた初速と角度に対する弾道を計算する。最後の draw_graph() 関数は、25 度から 75 度まで 10 度毎に弾道を計算してグラフ表示する。
確かに 45 度で飛距離が最大になっている事が観察できる。
プログラミング・チャレンジ(章末問題)
- #1: How Does the Temperature Vary During the Day?
- 2021-12-19 の東京とトビリシの予想気温を比較
- → Jupyter ノートブック
- #2: Exploring a Quadratic Function Visually
- 2 次関数のグラフを描画
- → Jupyter ノートブック
#3: Enhanced Projectile Trajectory Comparison Program→ スキップ- #4: Visualizing Your Expenses
- 歩数の曜日ごとの棒グラフを描画
- 横の棒グラフは Axes.barh(y, width) メソッドで描く
- 引数
yは 数量 でなければならない
- 引数
- ポイント: 縦軸に曜日のリストを表示する方法
barh()メソッドのyには、等差数列(等間隔に増加する数) のリストを渡すAxes.ytics()メソッドで、曜日 のリストを渡す
- 横の棒グラフは Axes.barh(y, width) メソッドで描く
- → Jupyter ノートブック
支出の可視化→ スキップ
- 歩数の曜日ごとの棒グラフを描画
- #5: Exploring the Relationship Between the Fibonacci Sequence and the Golden Ratio
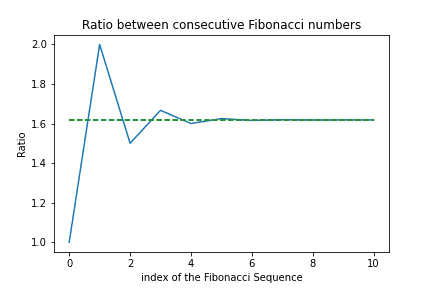
- フィボナッチ数列の隣り合う二項の比が黄金比に収束する様子を可視化
- フィボナッチ数列のリストを生成する
fib関数は与えられている - → Python の 内包表記 が便利だと悦に入る
ratio = [n / m for m, n in zip(fibo_seq, fibo_seq[1:])]
- → Jupyter ノートブック
破線は黄金比。結構速く収束することが分かる。
Chapter 3 のまとめ「Python からはじめる数学入門 - Chapter 3: Describing Data with Statistics を読む)」を公開しました!記述統計学の入門編と言える内容です。

